Decoding the ways of go garbage collector
One of the perks of Golang is that we don’t have to manage memory ourselves. There is a garbage collector which uses a mark-and-sweep algorithm to figure out which objects in memory are not used and marks those for collection.
GC Variables
The pace of GC cycles depends on the variables, which are:
- GOGC, which determines at what next size of the total heap garbage collection should happen. If it is set to 100, which means it’s 100% of the
current live heap at the end of the GC cycle, the next target heap size is 2x the current size (it is approximate due to GC roots, which are negligible compared to the live heap).
Target heap memory = Live heap + (Live heap + GC roots) * GOGC / 100
- There is a new variable, GOMEMLIMIT, which was introduced in Golang 1.19. The need for this new configuration variable was if the live heap keeps on increasing, then the next target heap size might be more than the available memory on the host, which can trigger OOM.
And in general, if we are setting GOMEMLIMIT, we should set it to a maximum of 90 to 95% of the total memory in the system, because some memory must be reserved for other system level tasks. Another thing that can happen is that if we set GOMEMLIMIT too low and the live heap size is more than this limit, then the system will try to bring the total heap used down, which won’t be possible, resulting in thrashing. golang A Guide to the Go Garbage Collector - The Go Programming Lan…
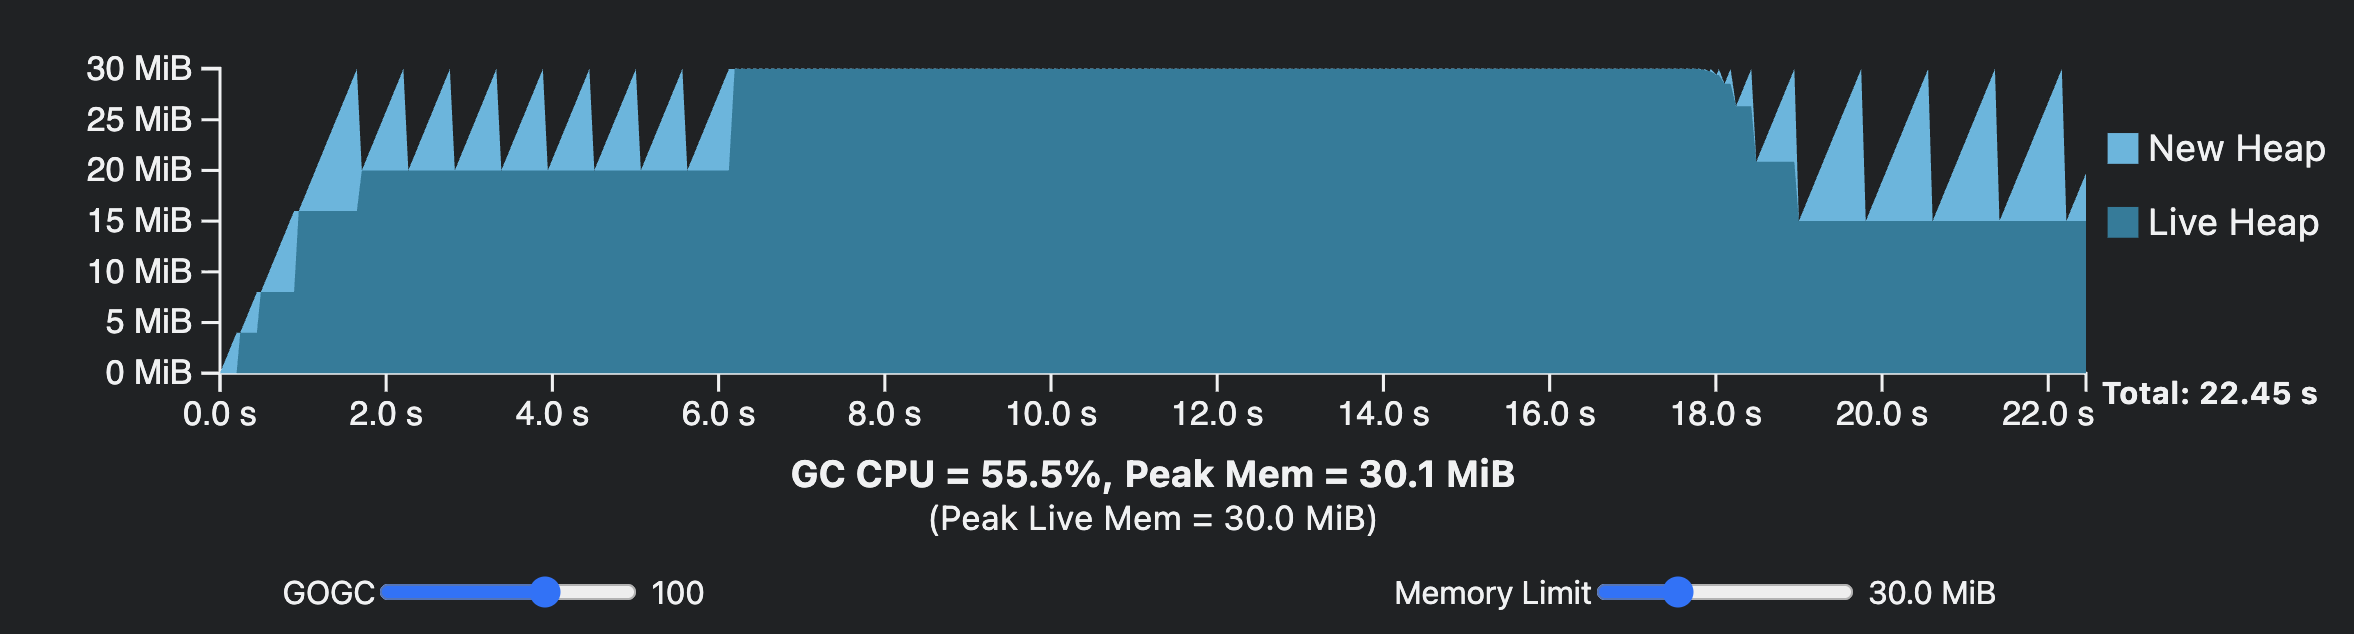
Note: GC variables should be configured in a way to reduce the number of CPU cycles that are spent on garbage collection while still keeping the average heap size over time manageable. Both are inversely proportional.
Go scheduler
A brief overview of how the goroutine scheduler works, because we will be discussing how GC stops processors P for collection. In the scheduler, there are no ofprocessors can be set by the GOMAXPROCS env. Each time a goroutine is to be processed, an OS thread, which is denoted by M, is attached to the P, for executing G the goroutine. https://agrim123.com/posts/goroutines-mpg.html.
When these goroutines are not working, they can be parked in the local queue of either P or in the global queue. There are two other types of interrupts where the goroutine execution is stopped:
When a syscall is made, the OS thread
Mis blocked with the goroutineG, and then it is detached from the processor. The processor can spawn another OS thread for executing another goroutine. In this case, both the M and G are stopped.When a network call is made, the processor and the OS thread are still available. The goroutine is stopped and is either parked in the local queue or the global queue based on where space is available. It waits for the
network pollerto return the status so that gorountine, can be picked up by some processor, and itGcan start reading from or writing to the file descriptor.
GC Stages:
When the next heap size target is hit, GC performs three steps:
Stop the world. At the start of the GC cycle, all Ps and Ms are stopped. For stopping them, all the goroutines have to return to a safe point, i.e. a function call. If there’s a goroutine which has a lot of internal computation, it will delay the GC execution, due to delay in reaching safe point. Once the “stop the world” happens at the start of the GC cycle, marking starts.
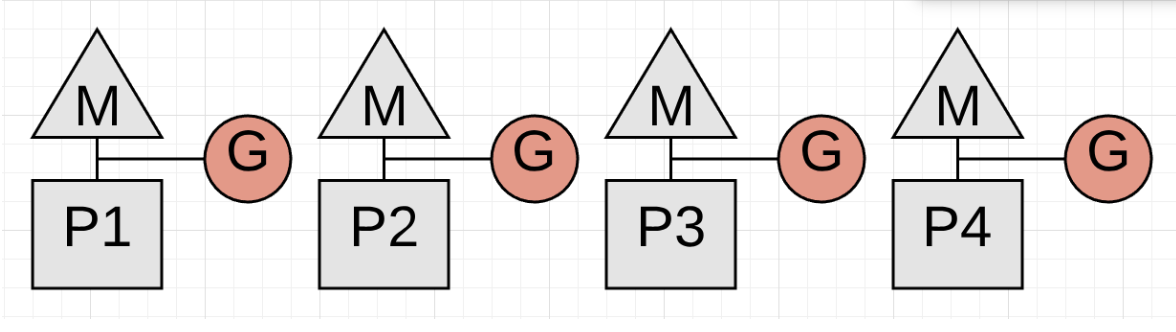
Marking. In this stage, about 25% of the available processors are taken to help with the collection process. During this, all other P are available to perform other computations, and then GC mark all the objects that have no references to them.
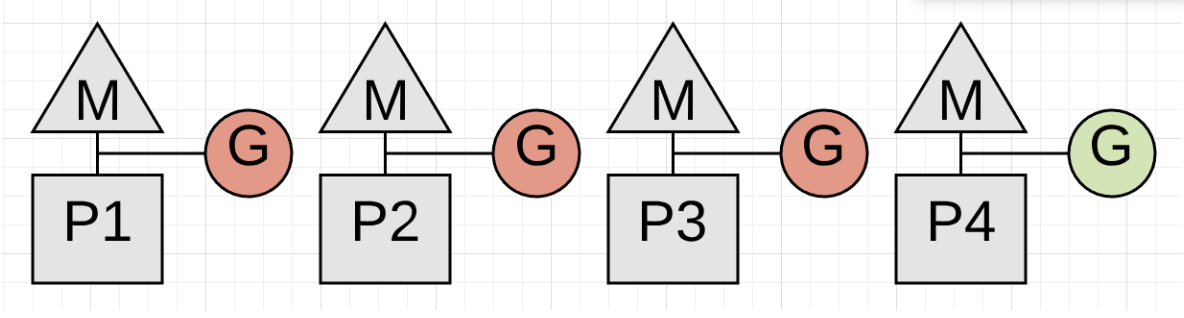
If it’s taking a lot of time, then some of the other processors will also be marked as mark assists, to help in figuring out which references are valid and helping in finishing the marking process faster.
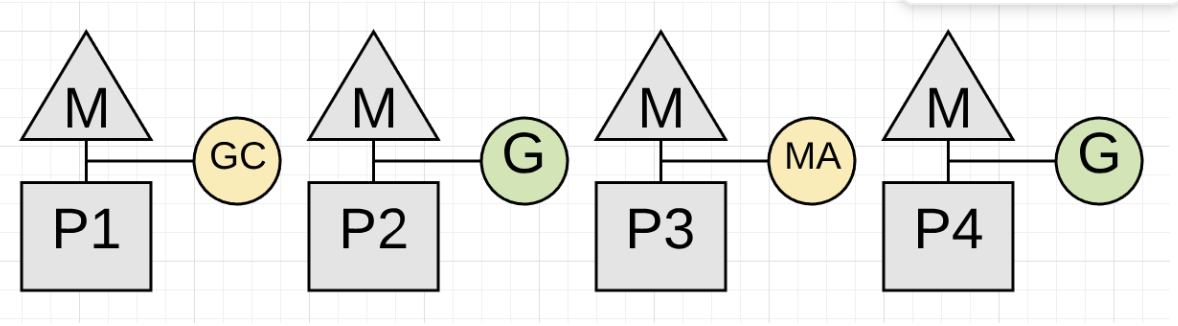
- Termination. GC performs “stop the world” and collect all the objects that are not live.
There is also a step called sweeping, which marks the newly deallocated space as available. The cost of sweeping is very negligible compared to the other steps. As a result, it’s not talked about from the optimization or performance POV.
GC logs
To enable GC logs for checking the GC state, use GODEBUG=gctrace=1 go run main.go
gc 1405 @6.068s 11%: 0.058+1.2+0.083 ms clock, 0.70+2.5/1.5/0+0.99 ms cpu, 7->11->6 MB, 10 MB goal, 12 P

// General
gc 1404     : The 1404 GC run since the program started
@6.068s     : Six seconds since the program started
11%         : Eleven percent of the available CPU so far has been spent in GC

// Wall-Clock
0.058ms     : STW        : Mark Start       - Write Barrier on
1.2ms       : Concurrent : Marking
0.083ms     : STW        : Mark Termination - Write Barrier off and clean up

// CPU Time
0.70ms      : STW        : Mark Start
2.5ms       : Concurrent : Mark - Assist Time (GC performed in line with allocation)
1.5ms       : Concurrent : Mark - Background GC time
0ms         : Concurrent : Mark - Idle GC time
0.99ms      : STW        : Mark Term

// Memory
7MB         : Heap memory in-use before the Marking started
11MB        : Heap memory in-use after the Marking finished
6MB         : Heap memory marked as live after the Marking finished
10MB        : Heap target to trigger current gc cycle

// Threads
12P         : Number of logical processors or threads used to run Goroutines
As you can see, even though the target was 10 MB, the GC cycle was triggered at 7 MB. This can happen when the application is heavily allocating, and the GC cycle can sometimes decide to trigger before the limit is reached. As you can see, the application was indeed heavily allocating, because while the GC cycle was running in the marking phase, where the other processors are free to run, 4 MB of extra data was allocated. At the end, only 6 MB of this total 11 MB was remaining, and the next target will be 12 MB because it is 2x the current live heap size. https://www.ardanlabs.com/blog/2018/12/garbage-collection-in-go-part1-semantics.html#:~:text=Listing%205%20shows,during%20this%20collection
When the application is heavily allocating, a GC cycle can be triggered before without hitting the target. This happens because of GC’s internal logic to prevent the total heap from growing very fast during the spikes. Usually, the GC cycle lasts a very short time, like 2 ms. In the above example, you can see at the start of the GC cycle it was 7 MB and at the end it was 11 MB. This means the application was heavily allocating.
The total CPU GC cycle time is determined by the live heap size. Because the GC iterates using global pointers and the local variables to find all the live heap allocations, the memory scanned is only limited to the live heap. Therefore, CPU time is proportional to it.
Links:
https://www.ardanlabs.com/blog/2018/12/garbage-collection-in-go-part1-semantics.html
https://www.ardanlabs.com/blog/2019/05/garbage-collection-in-go-part2-gctraces.html
https://tip.golang.org/doc/gc-guide#:~:text=This%20situation%2C%20where,the%20heap%20spike
https://www.zomato.com/blog/go-beyond-building-performant-and-reliable-golang-applications/